A Quick Guide to Net Revenue Retention Factor Analysis


Steven Forth is CEO of Ibbaka. See his Skill Profile on Ibbaka Talio.

Net Revenue Retention (NRR) or Net Dollar Retention (NDR) is one of the most important metrics for SaaS companies to track. Boards and investors hold management teams accountable for this metric and it is reported widely. Here is how Snowflake presents its key metrics. NRR is a top metric for the best SaaS companies.

Top-level NRR is important, but it is a composite metric based on multiple factors. Management teams need granular insight into the different factors that make up NRR. These factors are dependent on product packaging, but these six are the most important.

Positive NRR Factors
Growth in Package: Revenue growth attributed to increased use. This generally requires some form of usage based pricing. In the example below, the number of connections and the number of calls on those connections are used (this is for an API connector-style application)
Upsell: This is for movement to a higher tier in a tiered packaging architecture like Good Better Best.
Cross-sell: This is for the sale of other products and services. It is not always included in NRR, but when there is a tight coupling between products or a product and service it makes sense to include it.
Negative NRR Factors
Revenue Churn: This is revenue lost when customers cancel or fail to renew subscriptions. Many people obsess about churn, but there is a natural level of churn for most companies, and trying to do better than that churn can be a challenge.
Shrinkage in Package: When it is possible to grow in package it is also possible to shrink, if usage goes down. It is important to analyze growth and shrinkage and not to combine them into one metric. Growth drivers, and customers, and shrinkage drivers, can be quite different and the actions taken to encourage growth and discourage shrinkage are often quite different.
Downsell: We want customers to move up the ladder from Good to Better and Better to Best. That is what upsell refers to. But sometimes buyers move in the other direction, from Best to Better or Better to Good. That is downsell.
Ibbaka NRR Analyze
Ibbaka generally does a deep dive into NRR as part of a packaging and pricing engagement. To help us with this we have developed a number of analytical tools. We are putting these together into a new offer, Ibbaka Analyze.
This application takes data from your CRM, your billing management system, or your financial system and gives you a deep analysis of the NRR factors. This level of insight is crucial to making decisions on how to improve NRR. It can also be used to explore different price change scenarios. In future versions, we plan to have a version with our prediction and customer segmentation technologies.
Let’s look at an example. We used data from a SaaS company that prices based on API integrations. The data and pricing have been changed. to protect customer confidentiality.
The pricing model is as follows.

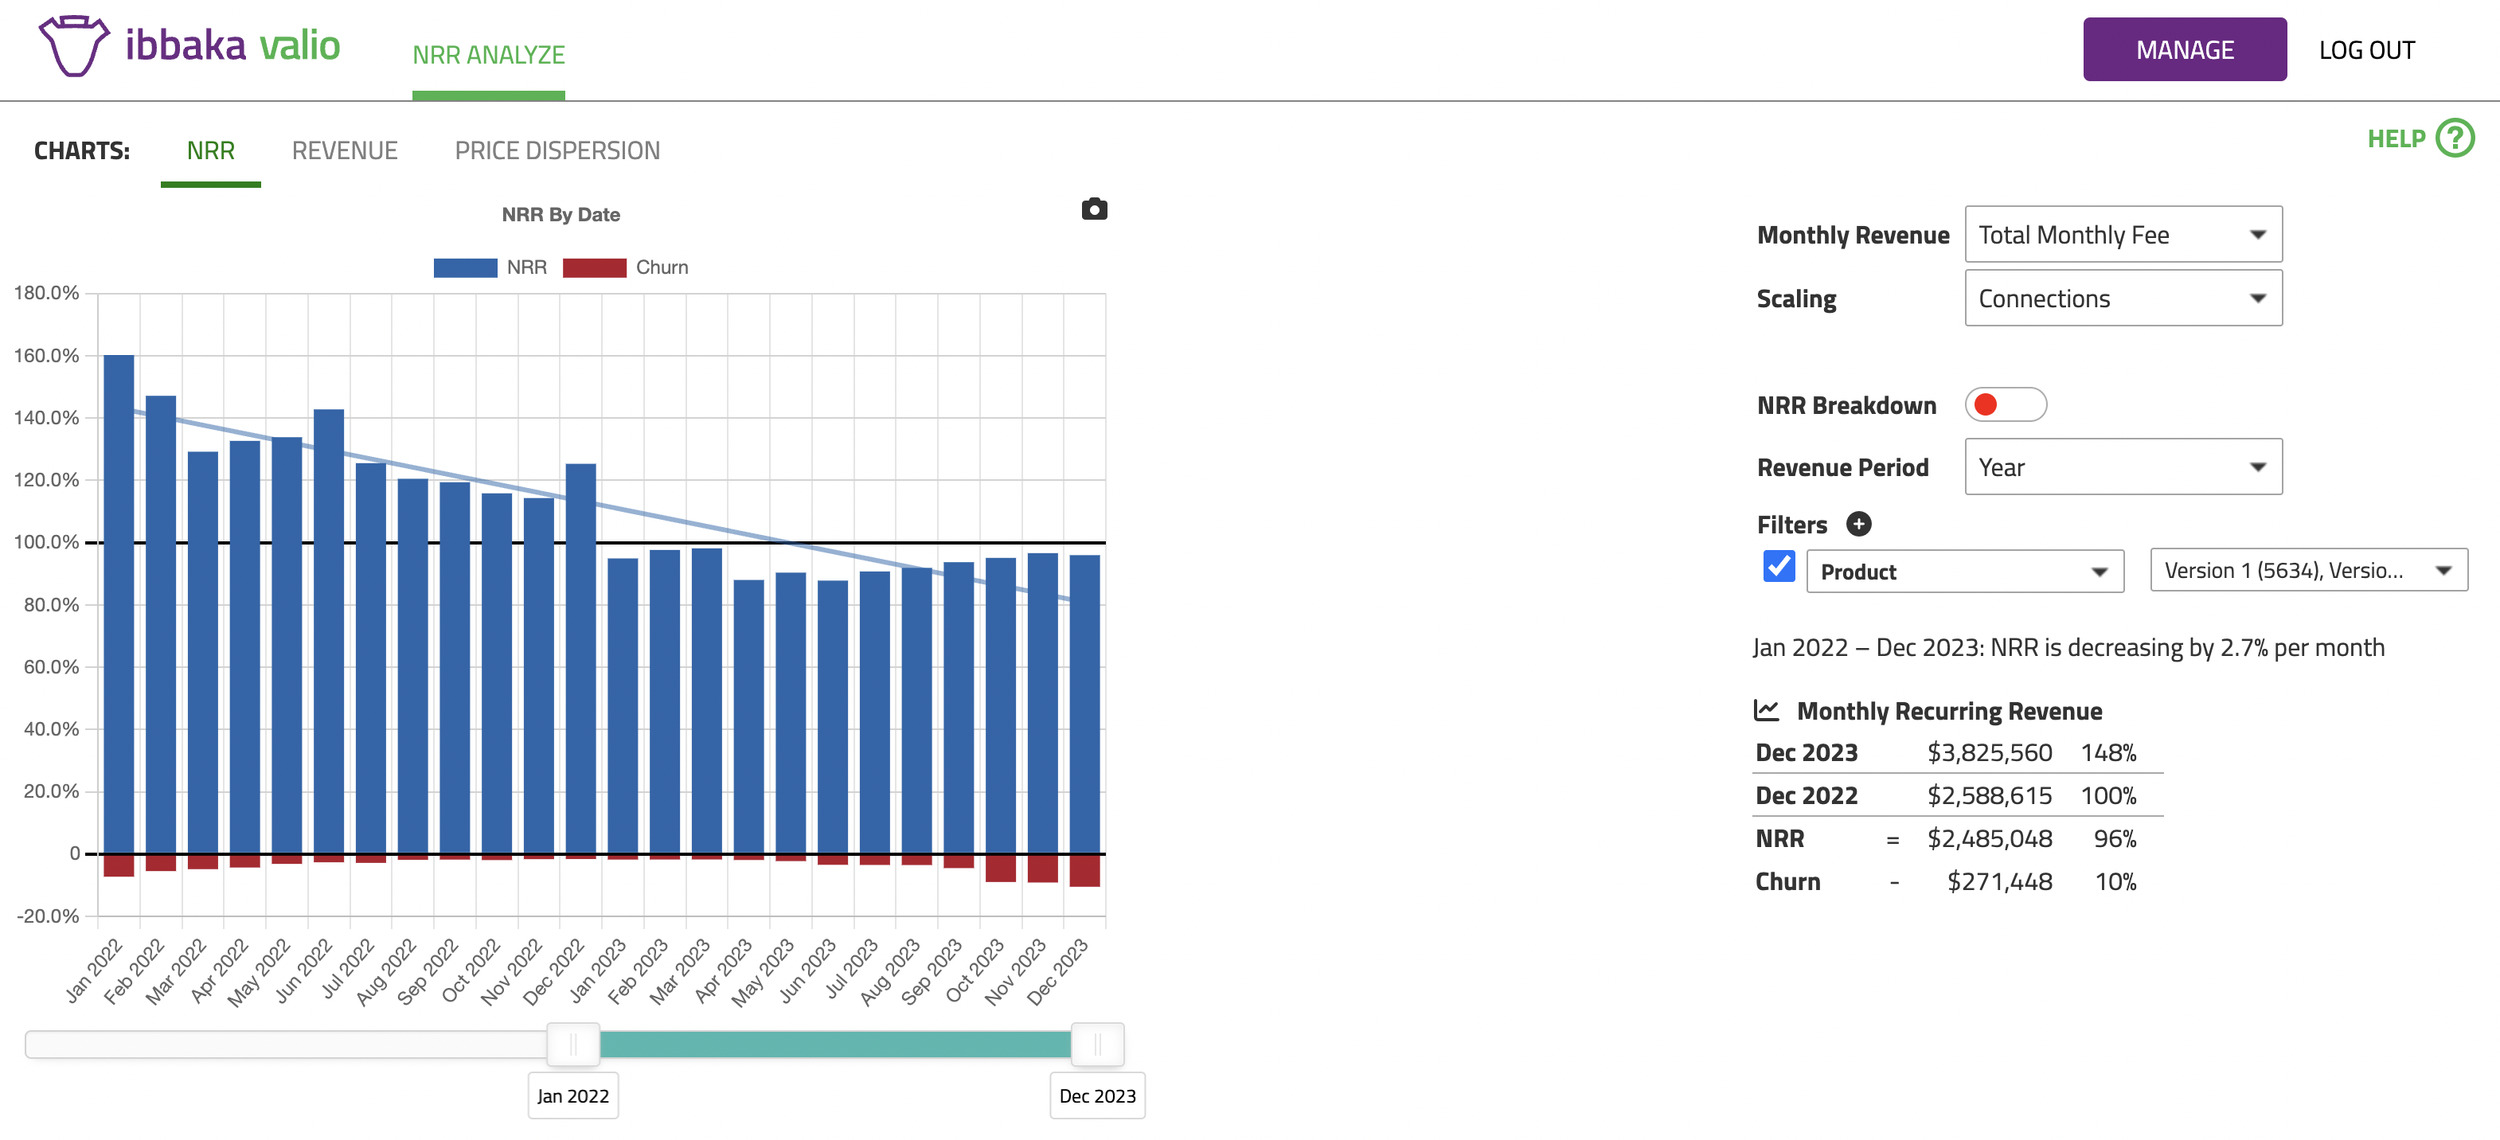
As you can see, this company has a tiered (Good Better Best) pricing architecture with three pricing metrics: a base subscription and two usage pricing metrics, one for the number of connections and one for the number of calls on those connections. It has changed prices every year. The software lets you zoom in on a specific time period and calculates the trend for that time period, and you can hover over any month to get detailed data. Clicking on the little camera lets you capture the graph for use in reports.
We loaded four years of data into Ibbaka NRR Analyze and got the following results.
Ouch. NRR is trending down and is below 100%.
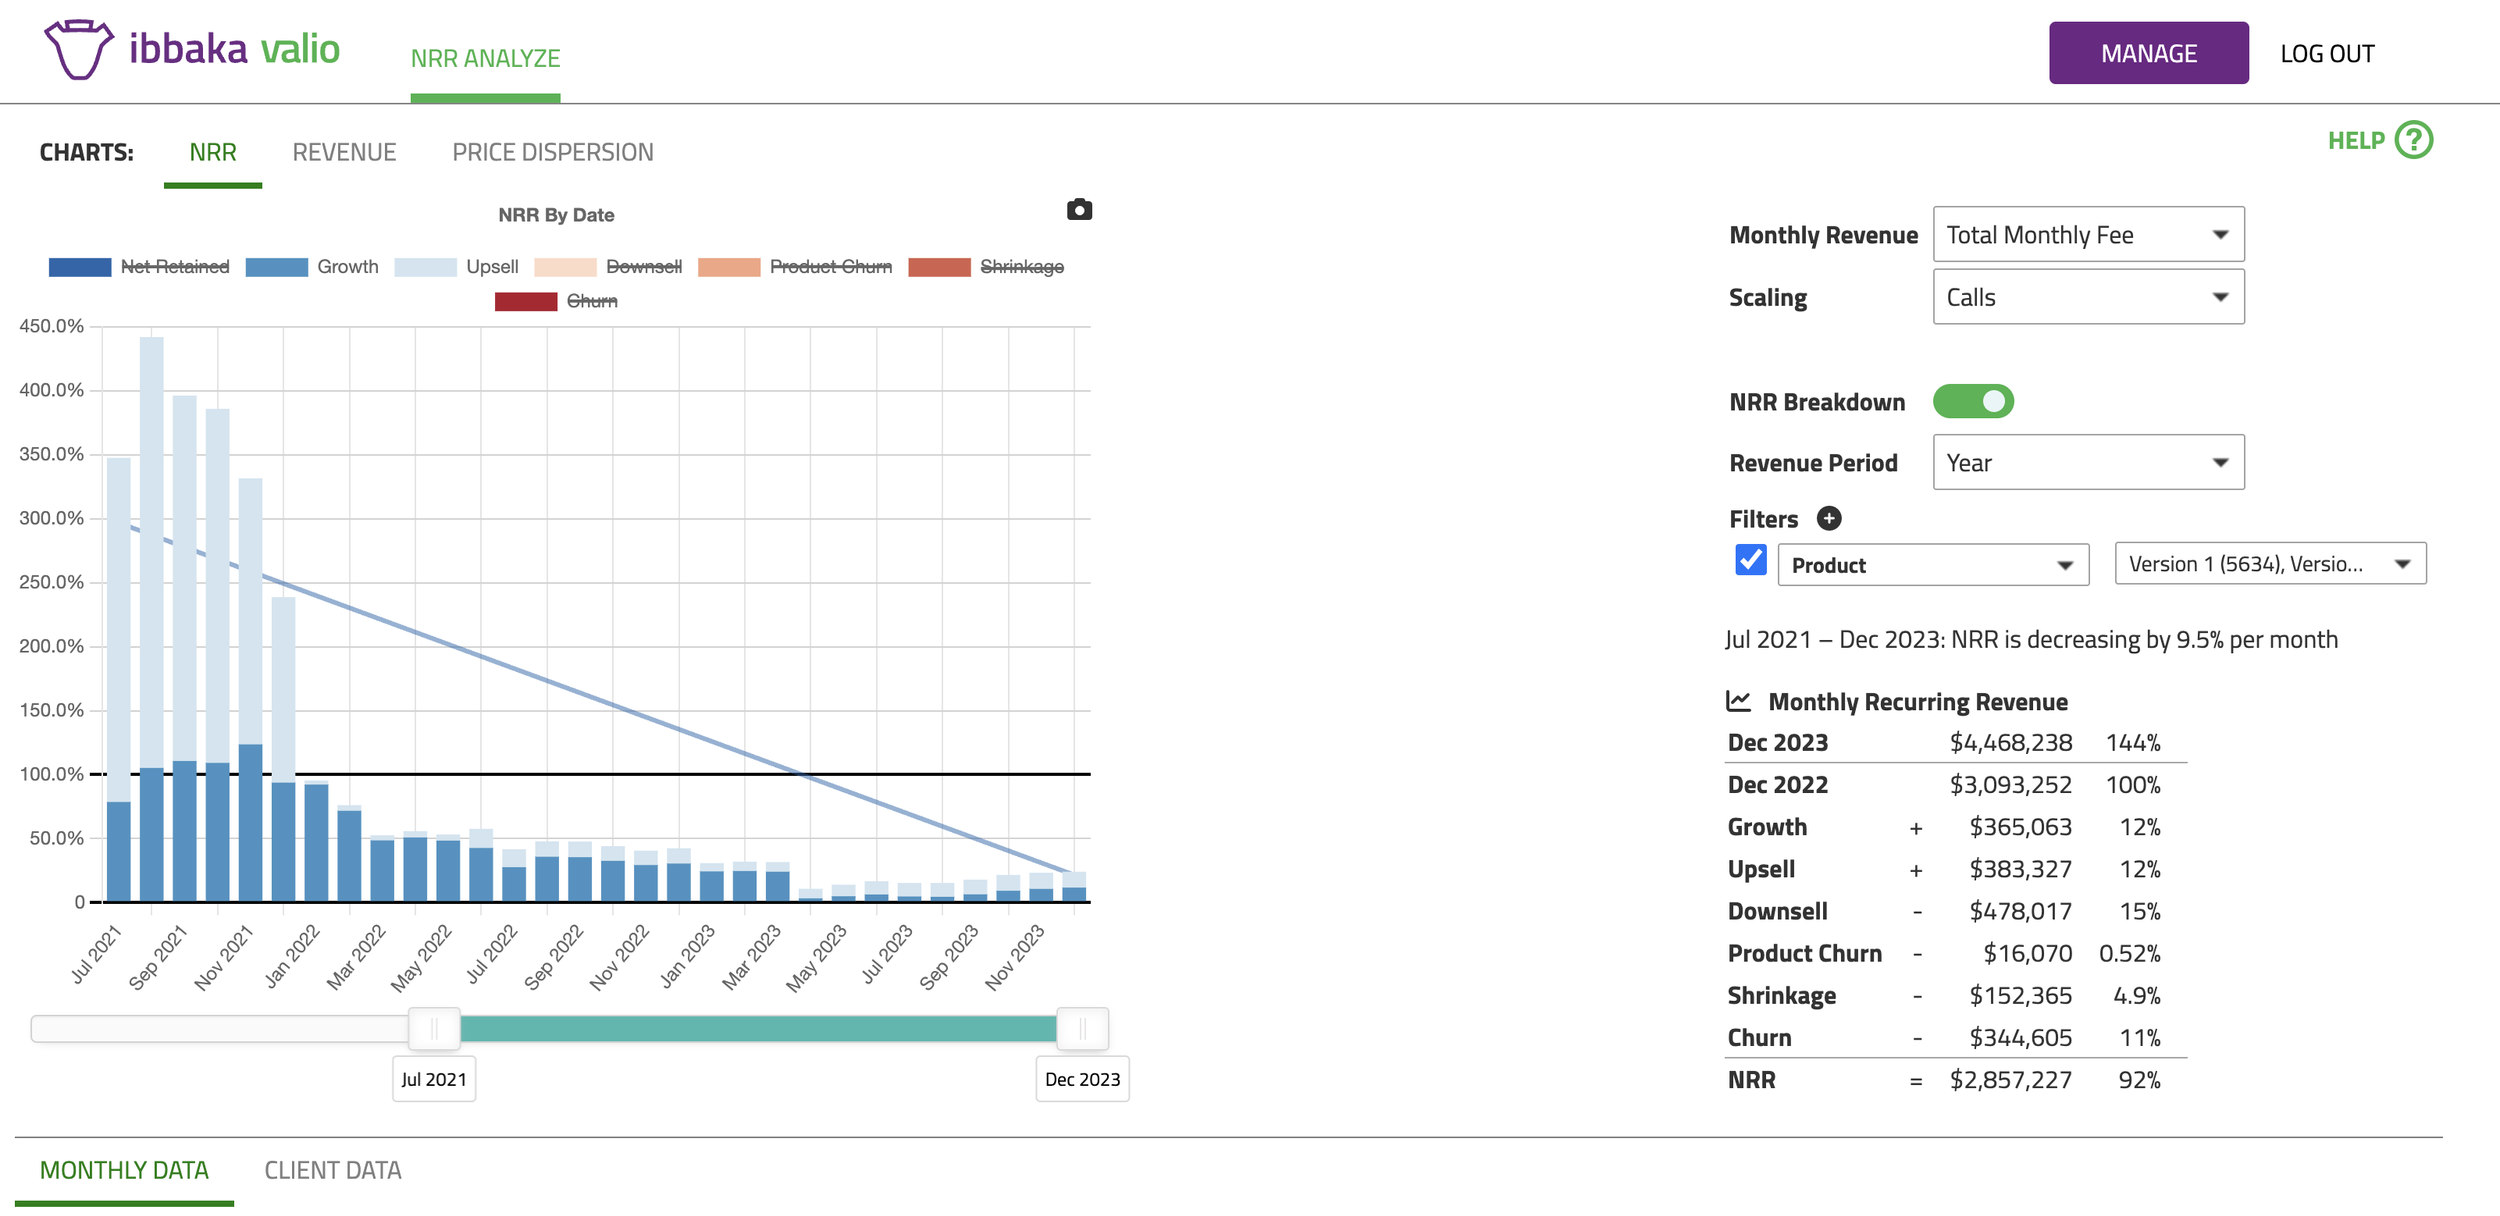
We can get a clearer view of what is happening by looking at all of the NRR factor at once. We do this by toggling on the NRR Breakdown (NRR factor analysis) so that we can see how each factor is performing.
This provides a lot more insight than just the top-level numbers, but there is perhaps too much data here. One can see that ‘growth in package’ was important early on but has been declining. Upsell has become more important over time. Churn is not the most important thing to focus on.

As people obsess with churn, let’s take a quick look at revenue churn for this company. It is always important to stay on top of churn, even when it is not the most important thing for every company.

Churn has been historically low but increased in the last quarter of 2023 and by December it had climbed to almost 10%. Red lights should be flashing.
But churn is not the only thing that determines NRR. This company uses two-factor usage-based pricing. How have growth in package and shrinkage in package been impacting NRR?

During the company’s high growth period, July 2021 through March 2023, growth in package (usage-based pricing) made a big contribution to NRR even when adjusted for shrinkage in package.
Then, around April 2023, the pattern switched, and there were six months when shrinkage in the package was greater than growth in package, and usage-based pricing pulled NRR performance down.
Was that the only problem? Let’s look at upsell (the contribution from companies moving from the Base package to Advanced and the Advanced package to Optimize) and downsell.

During the high growth period period upsell was much larger than downsell. But when growth slowed from June 2022 there was a period where downsell took more than upsell gave.
Which contributed more, growth in package or upsell?
Both were important, but in fact, upsell contributed a lot more than growth in package.
What happens when we compare the corresponding negative factors?

Downsell is more important than shrinkage in package.
What does all this tell us?
When things are good it is often the case that everything is good: churn is low, usage is growing and people are upgrading.
When the business turns sour trouble comes in threes: churn goes up, usage and usage-based revenue shrinks, and and customers downgrade.
Of course that is not always the case. We have seen many cases where churn is high but growth in package is often high. In the Peakspan-Ibbaka NRR Survey for 2024 (results will be published in early September) we found a few companies that combined high churn with high growth in package.

A quick guide to net revenue retention factor analysis
How should you analyze Net Revenue Retention by factor?
Start with the topline, what is the overall trend in NRR, and when does the trend change?
Look at churn. It is always important to know your churn. Churn means customers are disappearing and without customers, the positive factors have nothing to work on.
What factors are having the biggest impact? Put them in order for each month. Are there any changes in this order month to month? Do changes in order correspond to changes in trend?
Look at the good and bad together. Use the filters to compare growth in package with shrinkage in package and upsell with downsell.
Look at the positive factors together. Which factor is making the biggest contribution to growth?
Look at the negative factors together. Which factor is taking the most away from growth?
This analysis is the foundation of any strategy to improve Net Revenue Retention. Companies that try to fix NRR without the benefit of a solid understanding of what is changing and why tend to flail about.
NRR factor analysis gives you the information you need to prioritize actions.


